Periodic table of B2B digital marketing metrics
the 12 of April of 2016
the 12/04/2016
The Periodic Table of Elements is an arrangement of the chemical elements, by their atomic number (number of protons), their configuration of electrons, and their chemical properties. These arrangements show periodic trends, by placing elements with similar behaviour in the same columns.
Everyone knows the periodic table; it is at the heart of chemistry, the place where you can find all of the elements in one place and get all the information about them that you need. Would it be possible to create a periodic table of the main B2B digital marketing metrics, which also included the essential elements needed to understand the digital marketing industry?
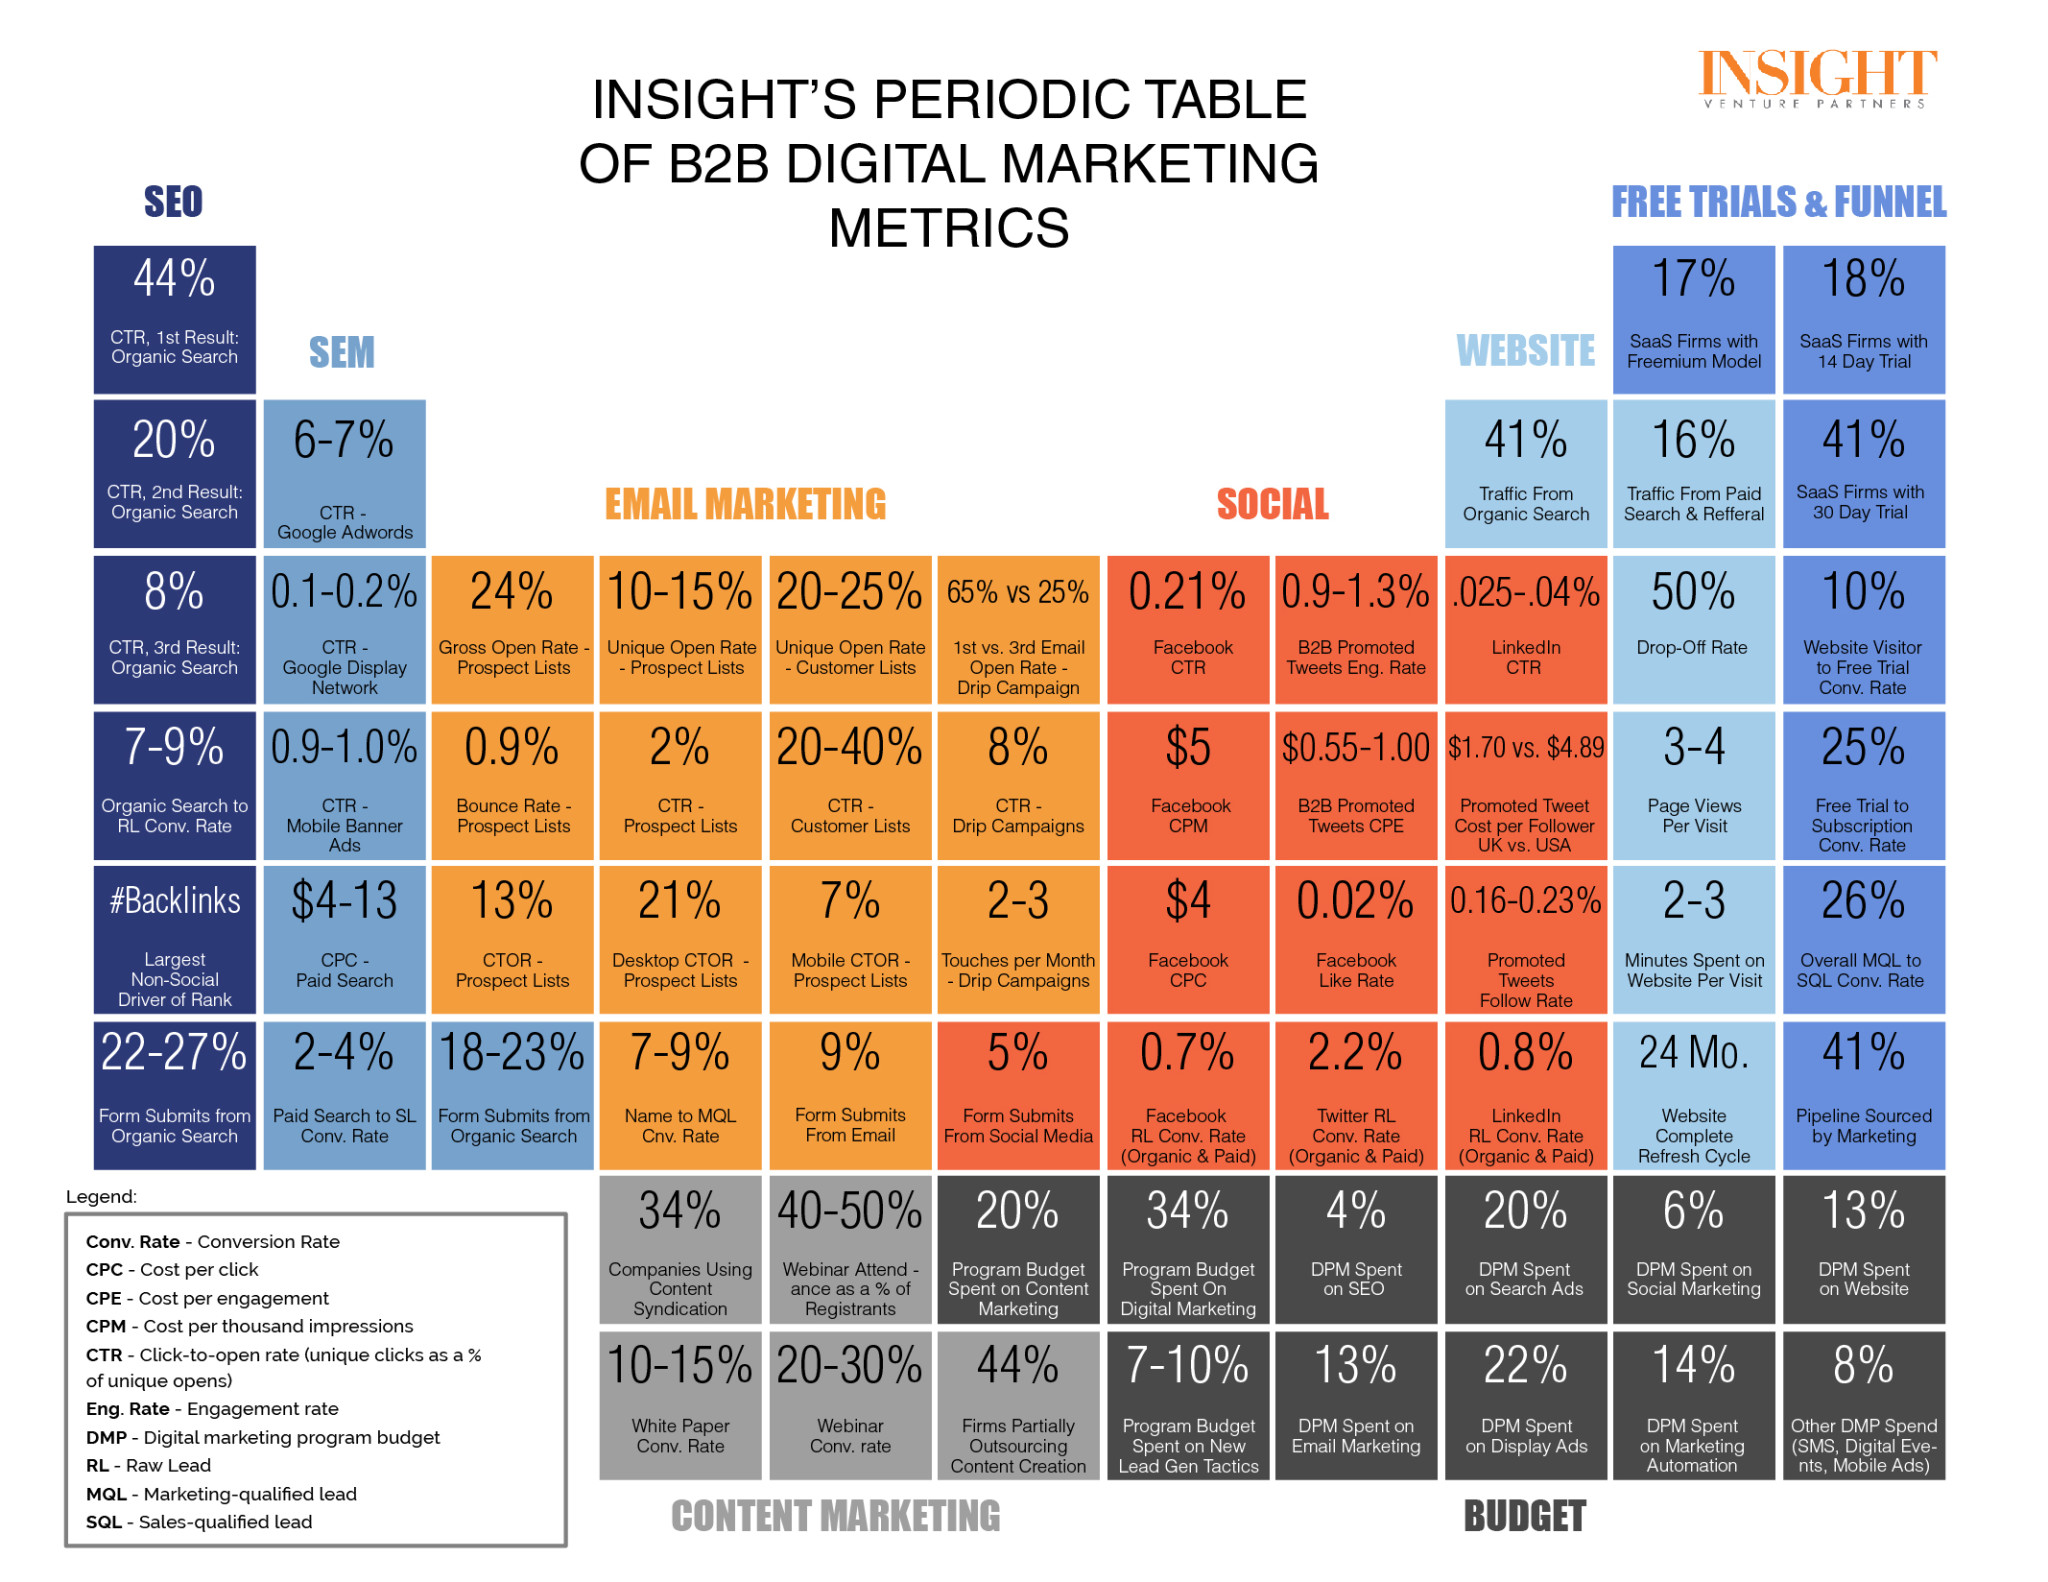
It would seem so; at least that’s what Insight Venture Partners have tried to do by designing a table of metrics for B2B digital marketing that intends to be a useful and practical guide to creating digital marketing tactics and strategies.
The periodic table of B2B digital marketing has been created to help find out the possible impact of each digital marketing action. It’s a way to get ahead of the final result, predict what could happen and decide what options are going to give your website and business the best results by letting you know the average impact of the digital marketing actions that you plan on launching.
TABLE OF CONTENTS
Discover the impact of your actions with the periodic table of B2B digital marketing
The data that was collected and put together to make the table comes from companies that work with Insight Venture. These are mainly venture capital companies therefore the data referenced in the table refers to the customer behaviour of these types of companies.
In addition, the table is completed with the publicly available data and reports from other investment banks. Using all of them, Insight Venture Partners have triangulated the information to come up with the averages and medians of the different metrics.
The periodic table of B2B digital marketing is divided into 8 large thematic groups that help you to better understand each of the marketing disciplines and analyze the results in more detail. These groups are:
- SEO
- SEM
- Email Marketing
- Social Networks
- Websites
- Content Marketing
- Budgets
- Free trials and funnel techniques
Below we are going to look at and analyse some of the main aspects involved in each of the sections of the periodic table of B2B digital marketing, as well as the average data:
1.- SEO
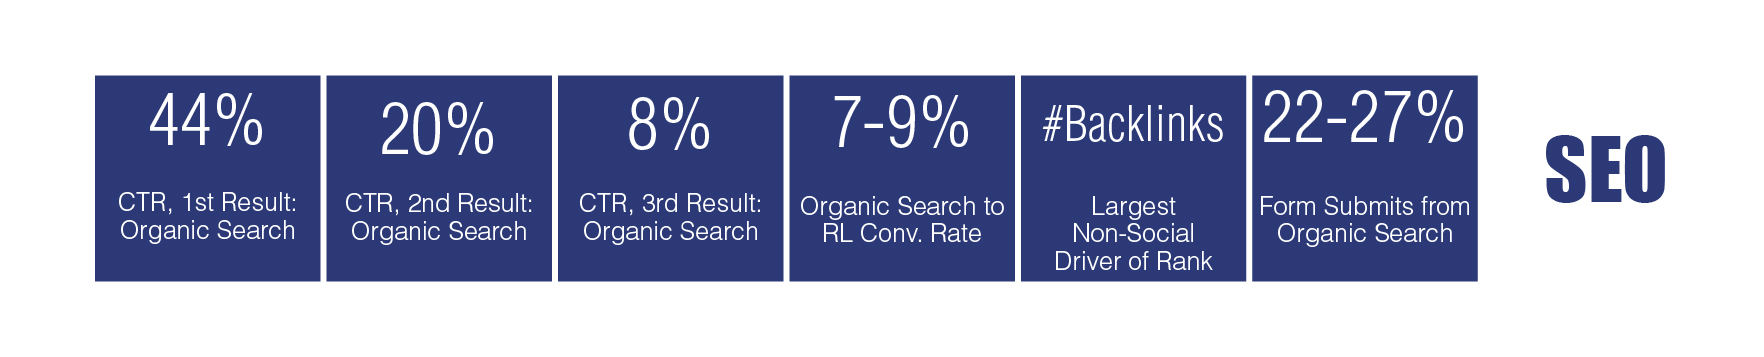
There are 6 sections that make up the group of elements known as SEO. The first 4 summarize the number of clicks and visits that your website can accumulate depending on its positioning in the search engine.
Therefore, if your website was in the top position, it would get 44% of the clicks, in the second position the number of clicks would drop to 20%, while the third position wouldn´t receive more than 8% of all of the clicks made on the Google search page.
It is estimated that between 7 and 9% of organic searches that are made end in conversion.
2.- SEM
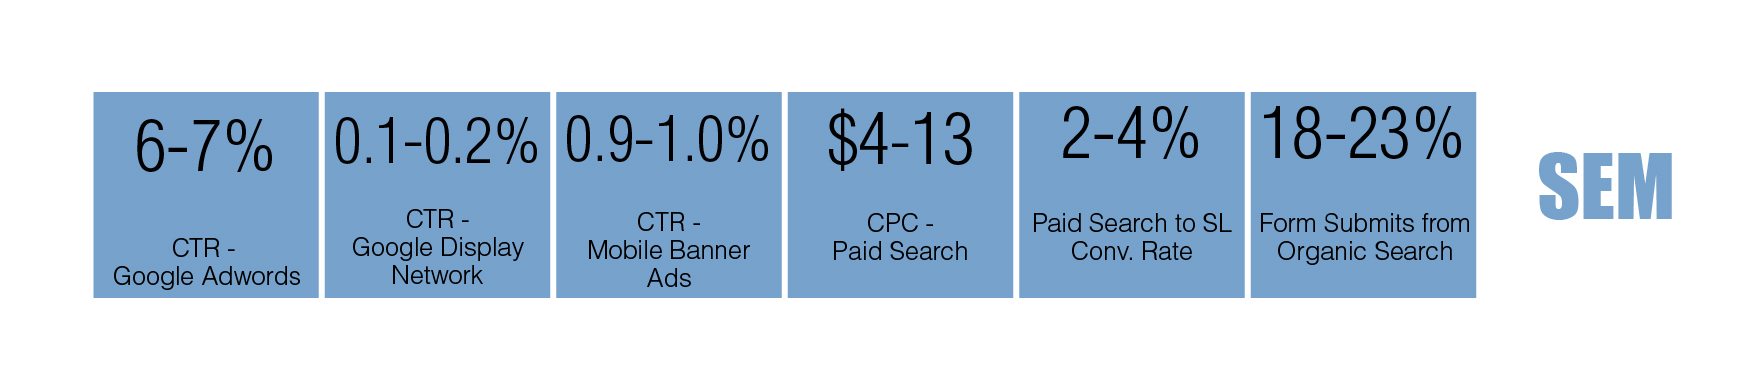
In addition, there are a further 6 indicators that can affect marketing positioning.
It’s interesting to see that the Periodic Table gives an estimate of the cost per click in the payment results. The estimated cost is between 4 and 13 dollars per click on the links that are located in the paid positions of the search engine.
What ratio of Google Adword Ads are effective? Between 6 and 7% of the ads published on this platforms are successful and end in conversion.
3.- Email Marketing
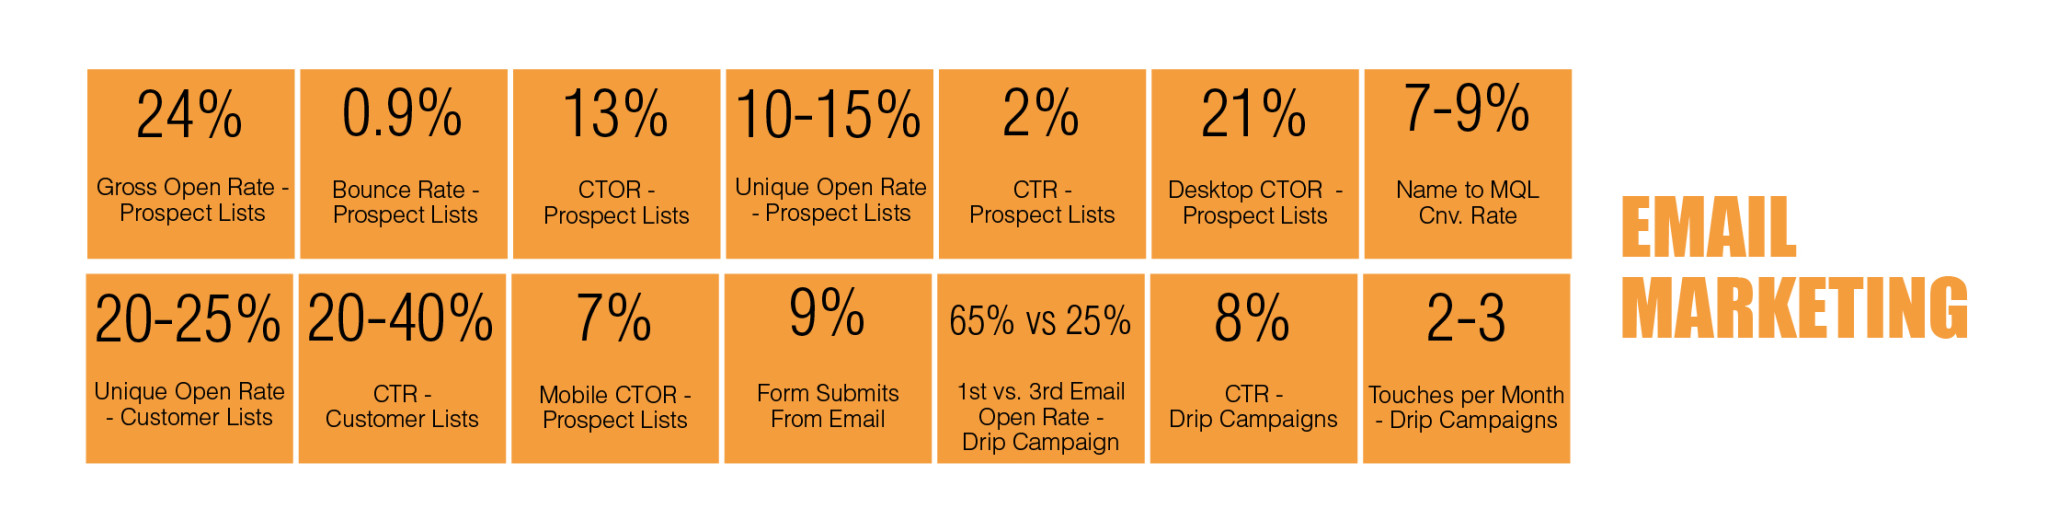
The 12 sections that are dedicated to email marketing summarize all of the actions that have an affect on what is one of the most common practices in marketing.
It is really interesting to see how most of the indicators in this group refer to the number of clicks, opens, and CTR that the emails receive. They are also good for finding out the extent of which an email marketing campaign can reach your users or not, the number of clicks that you can get, and in turn know up to how many users receive your message.
Its important to know how to analyse an email marketing campaign as most brands use these strategies to attract and keep their customers. The number of customers on an email subscriber list that receive an email and click on the links is around 20 to 40%, quite a broad ratio, but it does give an understanding of how diverse the user’s behaviour can be with this form of marketing.
4.- Social Networks
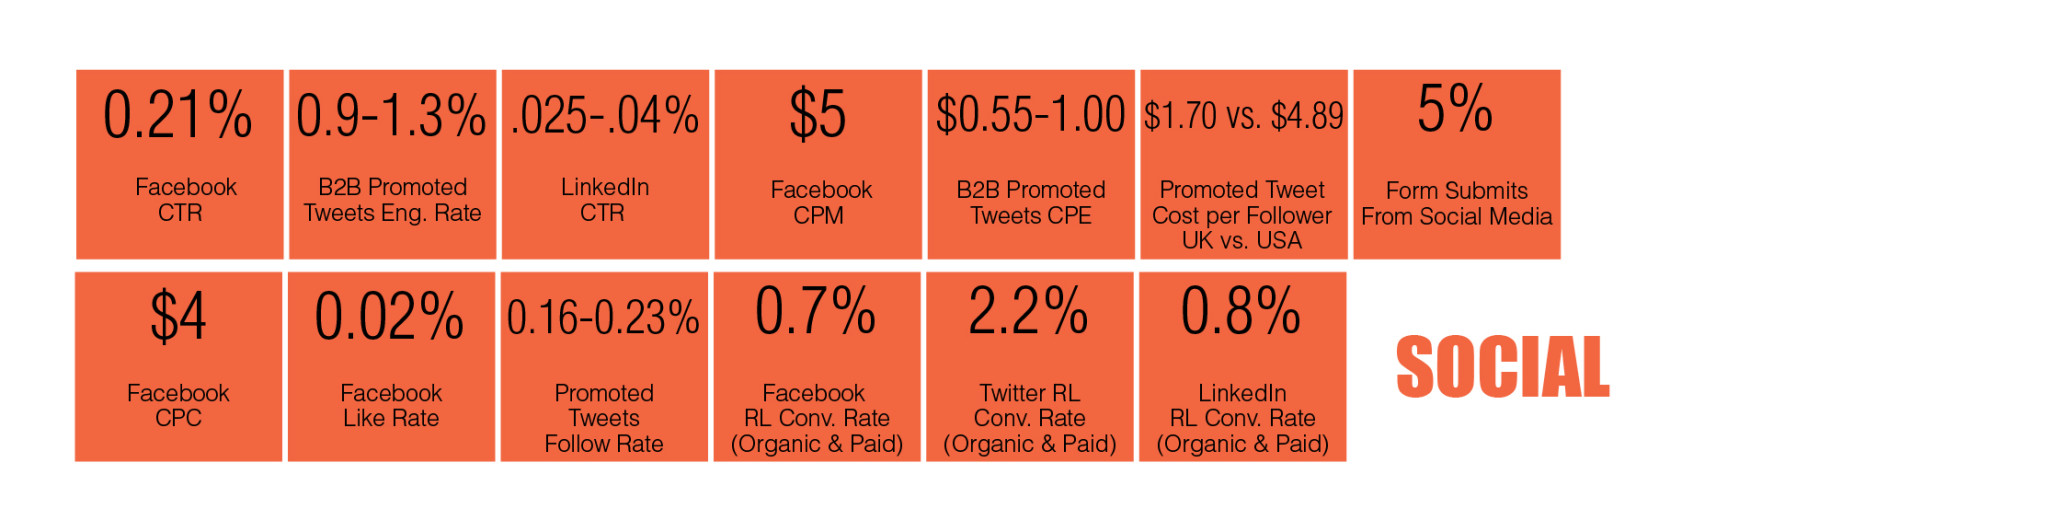
One method of marketing that has been gaining weight in recent years is Social Networks. However, you must bear in mind that each social network focuses on a different audience, they pursue different objectives, and their audiences are diverse therefore the B2B digital marketing metrics will be different.
With the elements that have been classified into the Social Networks group you will be able to predict the performance of the campaigns that you put into action on Facebook, LinkedIn and Twitter, calculate the costs, the number of clicks, and the potential business that each can generate.
Do you convert the same percentage of users as Facebook, LinkedIn or Twitter? The answer is no! According to the periodic table of B2B digital marketing, Facebook has a higher rate of conversion than LinkedIn or Twitter, mainly because the ads are better seen and their customers are more likely to click on them.
Despite that, Twitter is also a good conversion indicator as 2,2% of leads, both paid and organic, on this social network end in conversion.
5.- Websites
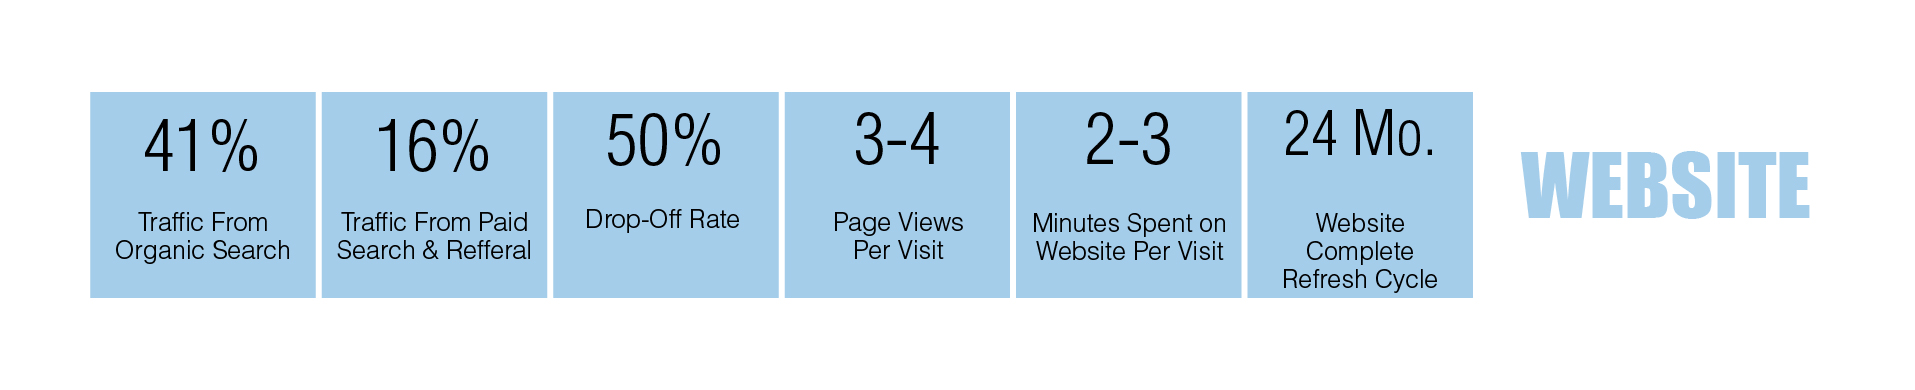
In addition to the SEO metrics that can affect the webpages, there are 6 more indicators in order to find out the volume of traffic that goes to your website, either organic (41%) or paid (16%). Another interesting aspect is the loss of visitors, which according to the data shows that 50% end up leaving the site.
With websites it’s also important to take into account the number of pages that a user sees during an average visit. A normal website visit usually has between 3 to 4 page views and lasts around 2 to 3 minutes.
6.- Content Marketing
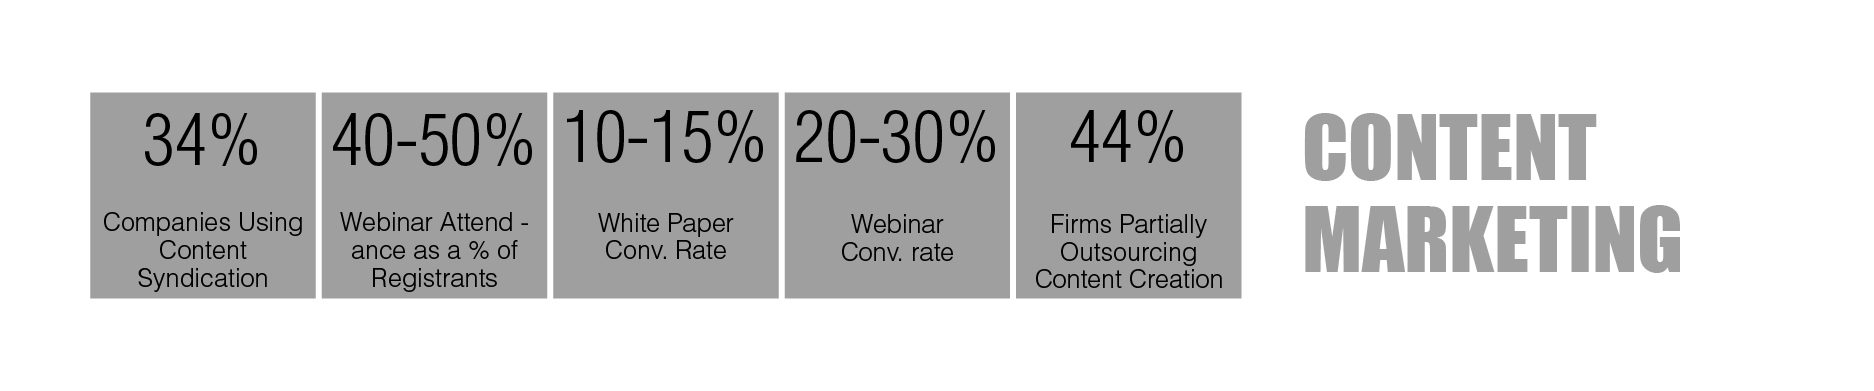
Content Marketing is another key indicator when trying to understand the behaviour of a website. Knowing the exact conversion rate that each piece of content contributes will hep you find out which elements to use on your website and which to offer as downloads.
Did you know that 34% of campaigns use syndicated content?
Have you considered that out of the number of people who register for a webinar, only 50% actually turn up?
Whitepapers are very useful and easy elements to incorporate into the structure of a website and they have a conversion rate of between 10 and 15%. In the case of Webinars they have a conversion rate of between 20 and 30%, around double the conversion rate generated by whitepapers.
7.- Budget
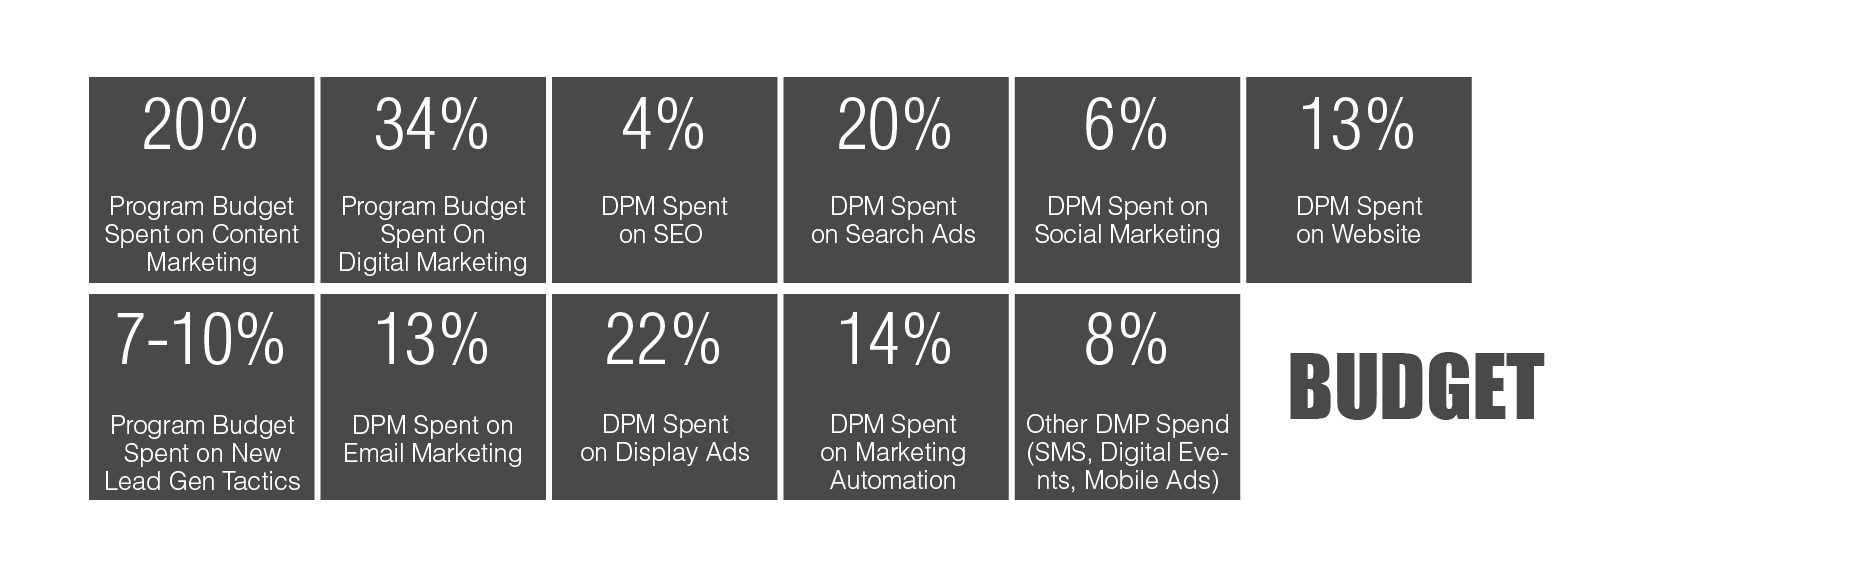
Managing the budget is one of the primary tasks. Knowing how much of the budget is wasted, what part of the budget should be allocated to content marketing, and also knowing how much is wasted on Ads, on positioning, or on social networks is essential to the success of a B2B campaign.
According to the data shown in the periodic table, 4% of the budget is designated for SEO and 13% goes on email marketing campaigns. Social marketing, which is based on social networks, accounts for 6% of total investment, with 13% for website development, and 14% for marketing automation.
All of this data is an average of the data that is published and shared by the companies that work in marketing. It’s always necessary to keep in mind that there are some companies that work better using one form of marketing than others, some work better investing more in SEO while others in Display retargeting.
8.- Free Trials and funnel techniques
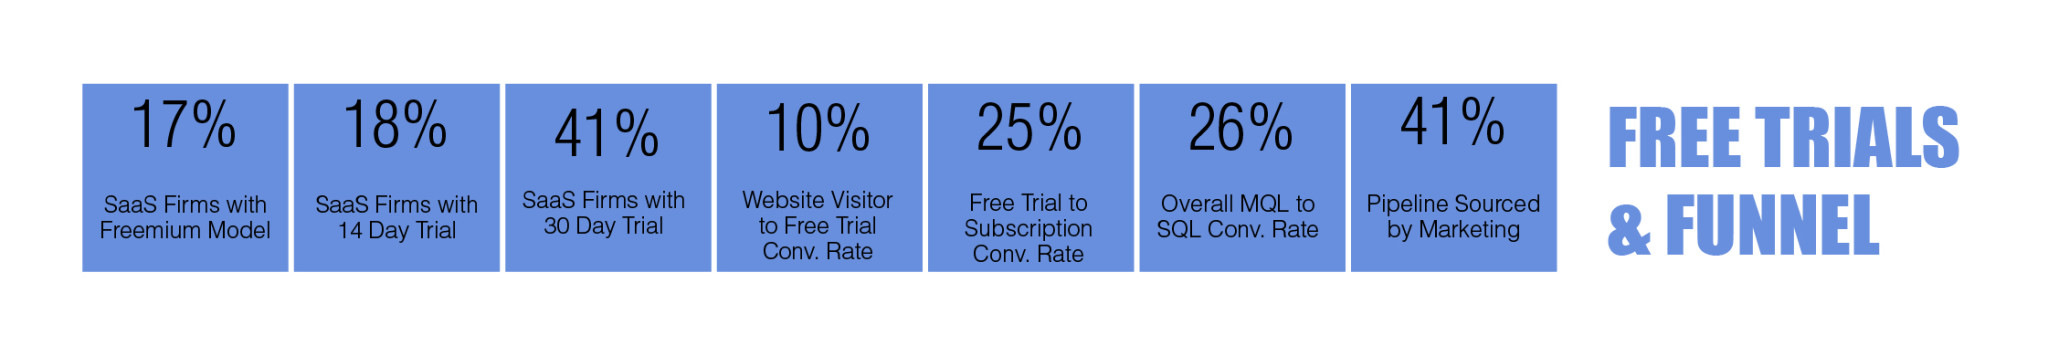
Finally, in Insight´s Venture Partners` B2B digital marketing table shows basic data relating to the percentage of users that pass through the sales funnel and convert after taking advantage of the free trials available on websites.
Thus, 41% of SAAS (software as a service) brand users ended up converting after trying a 30-day demo. In addition, 25% of the qualified marketing leads became qualified sales leads.
In short, Insight´s B2B Digital marketing periodic table is a quick and easy way of learning the average impact of the digital marketing actions that you can get up and running. It’s a way of getting ahead of the results and helps in choosing a more accurate digital marketing strategy.
All of this data will help you with your digital marketing strategy. Even more if you take advantage of a platform like MDirector, where you can manage all of your marketing actions in one place. With MDirector you have everything you need at your disposal to manage your marketing campaigns, from tools to create your newsletters, SMS or Landing pages to the potential of knowing your metrics in real time.


 and Its Importance in Email Marketing?")